
- To access Report Writer, navigate to Reporting > Report Writer by first selecting the HR Admin ADDITIONAL MODULES option in the top left.
- Here, you will have a list of the custom reports that have been created for your company already.
- To create a new report, select Add New in the top right.

- The next screen will prompt you to select a Report Type and a Title. Both are required. There are many different Report Types to choose from. This is what will define the view you will have while creating your report. Essentially, you are taking fields from standard reports we have in the system as a pool for you to build your report with.
- This guide will cover commonly used report types. Before diving into that piece, below is an explanation of the following screen after selecting your Report Type.
Fields
The Fields tab is where you will add the columns of information to your report.

- Filter – this serves as a search function for the below section labeled Available Fields. It enables you to reduce the amount of field options you see based on what you searched.
- Available Fields – this is where you will be pulling in your columns for your report. Each category is a dropdown menu with different options for columns to pull in. To add a field, simply click on one of the options in the category of your choosing.
- Report Columns – these are the columns that will appear on your report. Think of it as an Excel file: the first row will be column A, the second column B, and so on. You can rearrange the columns by clicking, holding, and dragging.
Sorting
The Sorting tab is where you will be able to determine how your report will be sorted. To sort your report, you will need to select the fields from the Available Fields area as you did when you were creating the report. They will then appear to the left. Just like in the Fields area, you can click, hold, and drag the fields in the Sorting Fields area to reorder them as needed.
Grouping
The Grouping tab is where you will be able to determine how your report will be grouped. To group your report, you will need to select the fields from the Available Fields area as you did when you were creating the report. They will then appear to the left. Just like in the Fields area, you can click, hold, and drag the fields in the Grouping Fields area to reorder them as needed.
When fields are grouped, they will be sectioned off in the report. For example, if I used CC1 (Cost Center 1) as a group, it will group up the report by cost center:


Filters
The Filters tab is where you will be able to determine how your report will be filtered. To filter your report, you will need to select the fields from the Available Fields area as you did when you were creating the report. They will then appear to the left. Just like in the Fields area, you can click, hold, and drag the fields in the Filter Expressions area to reorder them as needed.
After adding the field, you will need to pull in a few options to fulfill the Filter Expression. In the below example, I want to filter the report by the employees’ cost centers. I pulled in the field einfo.cc1, which will tell the report to look at the cc1 assigned to the employee’s profile.
You will see there are 3 boxes to fill in:

1. The first box will be a dropdown menu consisting of the following options:
a. = Equals – if pulled in, then the report will only pull in data that is equal to the value of Box 2.
b. < Is Less Than – if pulled in, then the report will only pull in data that is less than the value of Box 2.
c. > Is Greater Than – if pulled in, then the report will only pull in data that is greater than the value of Box 2.
d. < = = Is Less Than or Equal To – if pulled in, then the report will only pull in data that is less than or equal to the value of Box 2.
e. > = = Is Greater Than or Equal To – if pulled in, then the report will only pull in data that is greater than or equal to the value of Box 2.
f. <> Is Not Equal To – if pulled in, then the report will exclude the value of Box 2.
2. The second box is where you will determine what value you want to include in your filter. In the example we are using, we would want to input the value (or code) of a cost center. Here is the filter so far:

Now, the report will pull in employees in department 01. There is one more box that needs to filled in, Box 3, in order to finish the Filter Expression.
The third and final box, Box 3, is where you will pull in an 'And/Or' statement. This statement will mark this filter expression as a required filter or an optional filter.

By pulling in And, you will make this a required filter. By pulling in Or, you will make this an optional filter. For example, if And is used in the above example, then only employees in department 01 will be pulled in. If Or is used, you will need to add another filter, such as einfo.cc1 = 02. This way, the report will pull in employees department 01 or department 02.
Company
The Company tab only applies if you have access to multiple companies. On this tab, you will have two sections – Available Companies and Selected Companies. In the Available Companies section, you will see any companies assigned to you. Check the box off next to the company name to add it to Selected Companies. This way, you do not need to copy the report into each company you have access to!
Preview
The Preview tab is where you will preview your report. This is a valuable tool as you are building the report to ensure the proper fields are being populated. From here, you can export the file as a .PDF, an excel file, or you can print out the report.

Commonly used report types
Using the report type Employee Information
An Employee Information report pulls information assigned to the employee’s profile. This report is not designed to pull data from payrolls that have processed. For example, you would use this report type if you wanted to create a report that listed employees and their email addresses. You would not want to use this report to create a report that shows what employees were paid last year.

1. CC1 – 5 Description: In our system, departments are classified as Cost Centers, or ‘CC’ levels. You can have up to 5 different cost center levels. Your company may only utilize one level, so you would typically only use the CC1 Description field header.
a. This field area contains selections pertaining to the department level. Typically, you would use the option Name here to pull in the department name for a department assigned to an employee.
b. You can reference your different Department Codes and Descriptions under Company > Company Setup > Departments. If you do not have more detailed information (such as Address) pulled in for your departments, the majority of the data under CC1 Description would not pull outside of the CC1 and Name.
2. EE Deductions: You can pull in different data for employees’ deductions using this field area. Data that is stored in the employee’s deduction tab can be pulled in with various fields.
a. For example, if you want to see the Start Date for deductions, you can select the field StartDate.
b. If you want to see the actual deduction code, you will want to pull in Dcode.
i. To filter out unwanted deduction codes, you would need to switch over to the Filters tab on the top. You would then want to select Dcode again and then apply a logic statement to pull in the code you want to see. For example, if you only want to see PTMed deductions, you would pull in a filter as so:

3. EE Fringe: Similar to EE Deductions, this field area allows you to pull in data from your employees’ Fringe tabs.
a. The same logic would apply here – if you want to pull in a code, you would want to select Ecode to pull in an earning code.
i. If you wanted to only see GTL, you would apply the following filter:

4. EE Rates: This field area will enable you to pull in information from the employee’s rate tab – whether it be the base rate or any additional rate.
a. Some information contained in here would be the Rate or Salary, Start/End Date, and any departments that may be pulled in for the rate.
b. Each employee is assigned a home department (CC1) level when added in the system. However, a rate may have a different department pulled in. This is typically applied in the circumstance when an employee has additional rates for working in multiple departments.
5. Employee (EInfo): This field area will contain primarily basic demographic information for the employee.
a. For example, you can pull in an employee’s ID Number, Home Dept, address and more.
6. Employee Info More: This field area contains more demographic information not contained under the previous field area.
a. For example, you’d find an employee’s email address and phone number in this area.
7. Special EE Fields: This is a smaller field area that can contain the employee’s Age, Annual Salary, and Days of Service.
Using the Report Type Employee Payroll (Summary)
An Employee Payroll (Summary) report pulls both information assigned to the employee’s profile as well as summarized pay information. This report is not designed to pull pay data check date by check date. For example, you would use this report type if you wanted to create a report that showed the total amount of sick time paid in a year. You would not want to use this report type to create a report that shows how many hours of sick time was paid in each check date for the year. You could also use this to get summarized data for one specific payroll at a time.

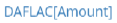
1. Payroll-Deductions: This field area contains data for deductions that were withheld in processed payrolls. Specifically, you can use this to retrieve totals for deductions, displayed by employee.
a. For example, you can see the amounts for AFLAC that have been withheld in the period you are running the report for:
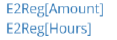
2. Payroll-Earnings: Like the Deductions counterpart, this field area can be used to pull in amounts for a defined period as well, but for earning codes.
a. There is an added field here, labeled Hours, so you can pull in hours for the earning code as well:
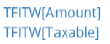
3. Payroll-Taxes: This field will contain information pertaining to the amounts and taxability of the employee’s taxes.
a. For example, if you would want to see the amount taxable to Federal Income (FITW), as well as the amount that was withheld, you can use the following fields:
Using the Report Type Employee Payroll (Detail)
An Employee Payroll (Detail) report pulls both information assigned to the employee’s profile as well as detailed pay information. This report is not designed to pull summarized pay data. For example, you would use this report type if you wanted to create a report that showed the amount of sick time paid in each check date for the year. You would not want to use this report type to create a report that shows the total amount of sick time paid in a year.
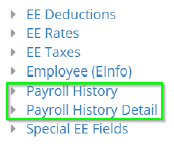
1. Payroll History: This area will contain detailed information that can be displayed per check date, rather than summary.
a. For example, you can pull in the Check Date here, as well as Hours and Gross, to show what the Gross pay was per check date.
2. Payroll History Detail: Expanding upon Payroll History, this field area will contain even further detailed information.
a. For example, you can pull in the earning code by using DetCode, and then see the Hours, Rate, and Amount paid out in a specific check date by using the respective field selections under this header.
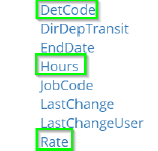
By pulling in these options from the same area, it will tell the report to pull the rate associated with the DetCode you pulled in.
b. If you combine the above with the Check Date from the Payroll History, this will show you the Code, Hours, and Rate paid by check date.
i. To further signify that you would only want to see earning codes, you would need to apply a filter using the Det field selection:

DET stands for Deduction, Earning, or Tax. By pulling in the filter = E, you are telling the report to only pull in data for earning codes.
Useful tips and suggestions
- Consistently preview the report as you build it. This way, you can confirm which columns are populating properly. This primarily applies to more advanced report with numerous filters/columns – if filters/values are entered incorrectly, your report may not populate. By previewing as you go, you can at least partially isolate which columns may not be working.
- You can change the column header names by selecting the blue ‘I’ icon in the fields area. You can also tell the report to get a sum total or average for the field in the box that appears after selecting the icon.

- Payroll-based reports (such as the summary or detail report) will have a Set Date tab that will allow you to define the date range for the report.

- Have a report that you like the structure of and want to build a separate similar report that uses it as a foundation? Clone it! If you utilize the blue clone button to the right of the report, it will copy the report exactly and enable you to add on more fields and save it as a separate report.

- Try out new reports! It is the best way to learn. If you are building a report and it doesn’t seem to be populating the data you are looking for, please contact our Client Support Team at support@checkwriters.com. We will be happy to lend you a hand in building the perfect report for you!